A few months ago a South Florida store owner sent me a message that I've now seen a hundred variations of. Traffic was fine. Ad spend was steady. Google Analytics said thousands of people were landing on the product pages. But sales had quietly flatlined, and nobody could say why. When I ran the site on a real phone over a normal cellular connection — not the store owner's office WiFi, not a top-tier iPhone — the main product image took almost six seconds to appear. The "Add to Cart" button jumped down the screen half a second after it loaded, so the first tap landed on a size selector instead. On mobile, roughly two out of three visitors were gone before the page was even usable.
That's the thing about site speed: it doesn't show up as an error. Nothing is broken. The page "works." It just leaks money, silently, one impatient thumb at a time. Core Web Vitals are Google's attempt to put numbers on exactly that experience — and in 2026 those numbers map more directly to your revenue than almost anything else you can control on your own site. Let me walk you through what they are, how much they really matter, and what I'd fix first if this were your store.
What Core Web Vitals actually measure in 2026
Core Web Vitals are three metrics Google uses to describe how a real page feels to a real person: how fast it loads, how quickly it responds to a tap, and how much it shifts around while it settles. They are not academic. Each one corresponds to a specific moment of frustration you've felt yourself.
LCP — Largest Contentful Paint (loading)
LCP measures how long it takes for the biggest visible thing on screen — usually your hero image, product photo, or headline — to render. It answers the question, "how long until this page looks like it has actually loaded?" The targets, measured at the 75th percentile of your real visitors, are:
- Good: 2.5 seconds or faster
- Needs improvement: 2.5 to 4.0 seconds
- Poor: slower than 4.0 seconds
The 75th-percentile part matters. It means you don't get to grade yourself on your best-case load. If one in four visitors has a slow experience, you fail — and the visitors on older phones and weaker connections are exactly the ones most likely to bounce.
INP — Interaction to Next Paint (responsiveness)
INP is the metric a lot of people still haven't caught up on. In March 2024 it officially replaced FID (First Input Delay) as a Core Web Vital, and it's much harder to game. FID only measured the delay before the browser started processing your very first tap. INP measures the full latency of essentially every interaction across the visit — tap, click, keypress — from the moment you touch the screen to the moment the page actually paints a response. Thresholds:
- Good: 200 milliseconds or less
- Needs improvement: 200 to 500 milliseconds
- Poor: over 500 milliseconds
INP is where heavy JavaScript sites get exposed. A page can load fast and still feel like it's stuck in mud every time you interact with it, because the browser's main thread is busy chewing through scripts instead of listening to your taps. If your site felt "janky" but you couldn't explain why, INP is usually the reason.
CLS — Cumulative Layout Shift (visual stability)
CLS measures how much the page jumps around as it loads. That button that slid down and cost my store owner a sale? That's CLS. It's a unitless score:
- Good: 0.1 or less
- Needs improvement: 0.1 to 0.25
- Poor: over 0.25
Layout shift is uniquely infuriating because it actively punishes engaged users — the people who tried to click. And for a checkout flow, a mis-tap at the wrong moment isn't a minor annoyance, it's an abandoned cart.
Lab data vs. field data — why your Lighthouse score lies to you
Here's a trap I see constantly. Someone runs their site through PageSpeed Insights or Lighthouse, sees a green "95," and assumes they're fine. Then their actual Core Web Vitals in Search Console are red. Both can be true at once, because they measure different things.
- Lab data is a synthetic test: one simulated device, one simulated network, run once, in a controlled environment. It's great for debugging because it's repeatable, but it is not your customers.
- Field data comes from the Chrome User Experience Report (CrUX) — anonymized, real measurements from actual Chrome users on your site over a rolling 28-day window. It captures the messy reality: three-year-old Androids, spotty LTE, forty browser tabs open.
The part that matters for your wallet: Google uses the field data (CrUX), not your Lighthouse score, when Core Web Vitals factor into ranking. So chase the field numbers. Use lab tools to diagnose, but judge yourself on what real people experience. If you don't have enough traffic for CrUX to report field data, that's a signal too — you're being graded on a broader dataset, and the fixes below still apply.
The honest truth: rankings vs. revenue
This is where I'm going to be more direct than most agencies, because the marketing world has badly overhyped one side of this and undersold the other.
The SEO impact is real but modest. Core Web Vitals are a genuine Google ranking signal, but they're a tiebreaker, not a trump card. Relevance, content quality, and authority still do the heavy lifting. A blazing-fast page about the wrong thing will not outrank a slightly slower page that actually answers the query. If someone promises you'll "rocket to page one" just by fixing your LCP, they're selling you a story. Realistically, speed helps you win when you're already competitive — it breaks ties in a crowded results page, and it keeps you from being demoted below equally-relevant-but-faster competitors.
The conversion impact is where the money actually is. This is the part people underrate. Speed affects your revenue directly, on every single visit, whether the traffic came from Google, an Instagram ad, or an email — completely independent of rankings. The commonly cited industry numbers are directional, not gospel, but they're remarkably consistent:
- Google and Deloitte's retail research found that a 0.1-second improvement in mobile load time was associated with roughly an 8% lift in retail conversions and even more in travel.
- Amazon's oft-quoted internal finding pegged every 100ms of latency at about 1% of sales.
- Multiple case studies on INP specifically show that cutting interaction latency measurably reduced bounce and lifted conversion, because a responsive page feels trustworthy.
Don't take any single percentage to the bank. Take the pattern to the bank: faster reliably converts better, and the effect compounds on mobile, on paid traffic, and at checkout. If you're spending money to send people to a slow page, you're paying full price for traffic and then throwing a chunk of it away at the door. That's the real cost, and it dwarfs the ranking question.
Where the time actually goes — the usual culprits
After enough audits, the offenders are almost always the same short list. In rough order of how often they're the problem:
- Images. The number one LCP killer, every time. Huge uploads served at full resolution, old formats like JPEG and PNG where AVIF or WebP would be a fraction of the size, no lazy-loading for below-the-fold images, and — critically — no width and height set, which also causes CLS.
- Render-blocking JavaScript and CSS. Scripts and stylesheets the browser has to download and process before it can show anything. Every one of them delays your LCP.
- Hydration and heavy client-side JavaScript. Single-page apps that ship a giant bundle, then make the browser re-run all of it to "hydrate" the page before it's interactive. This is the classic INP wrecker.
- Third-party scripts. Chat widgets, analytics, tag managers, ad pixels, A/B testing tools, review embeds. Each one feels harmless. Ten of them together own your main thread. This is the most underestimated culprit I see — a site can be beautifully built and still get dragged down by a marketing team's script pile.
- Fonts. Custom fonts that block text from rendering, or that swap in late and shove your layout around. Beautiful typography, terrible if it costs you a second of blank screen.
- No caching or CDN. Serving every asset from a single origin server, uncached, so a visitor in Florida and a visitor in Seattle both wait on the same distant box. Repeat visitors re-download everything they already had.
What to actually fix, in priority order
You don't need to fix everything at once. You need to fix the things holding your worst metric hostage. Here's the order I work in, because it front-loads the biggest wins:
- Fix your LCP image first. Identify the single largest element in the initial viewport. Compress it, convert it to AVIF or WebP, serve a correctly sized version for mobile, and mark it as high-priority so the browser fetches it immediately instead of treating it like every other asset.
- Set explicit dimensions on everything. Every image, video, ad slot, and embed gets a defined width and height (or reserved space). This alone can take CLS from red to green in an afternoon.
- Put a CDN in front of your assets. Cache static files at the edge so they're served from a location near your visitor, with long cache lifetimes for anything that doesn't change.
- Tame your JavaScript. Code-split so each page only ships what it needs, defer anything non-critical, remove dead code, and break up long tasks so the main thread can respond to taps. This is your INP lever.
- Audit third-party scripts ruthlessly. List every external script, and for each one ask, "does this earn its cost?" Delete what you can. For the survivors, load them after the page is interactive, or only when a user actually needs them — a chat widget can load on click, not on arrival.
- Self-host and preload fonts. Use font-display so text shows immediately, preload the critical font, and subset it to the characters you actually use.
- Improve server response time. A slow time-to-first-byte poisons every metric downstream. Static generation, caching, and a decent host fix most of this.
Work top to bottom, re-measure your field data after each change, and stop when you're comfortably in the green at the 75th percentile.
How a modern stack makes this easier
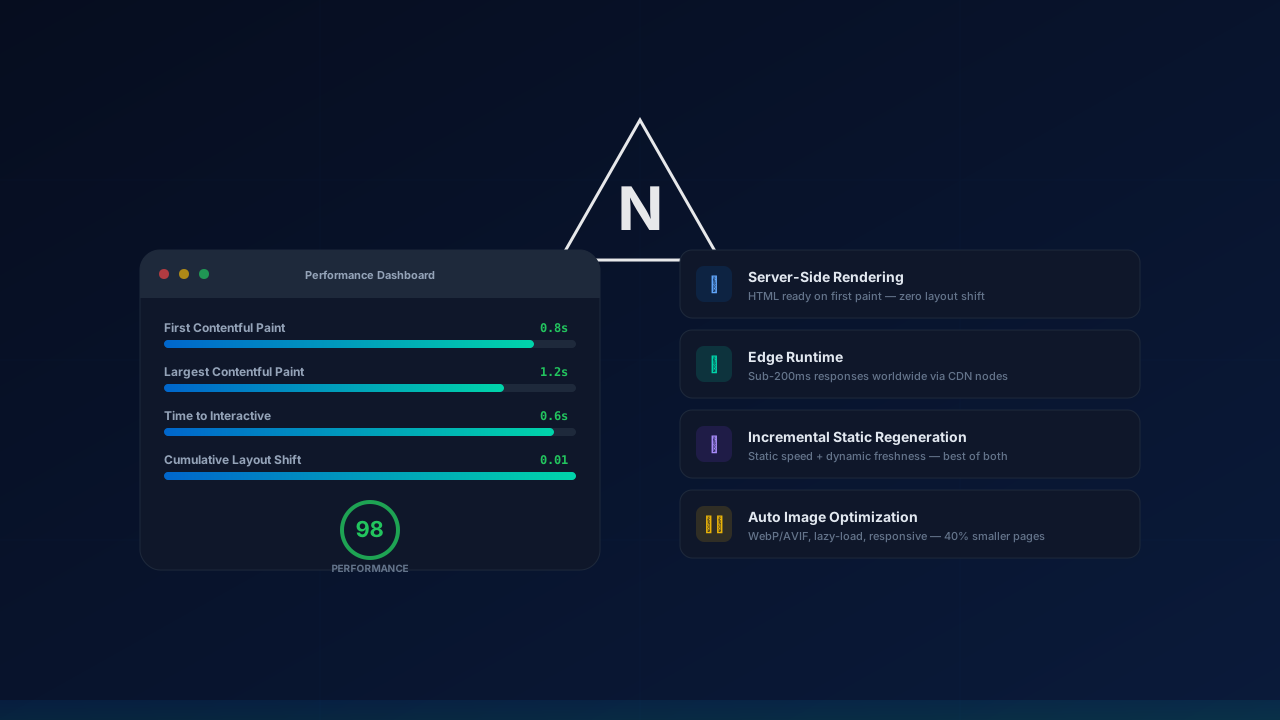
You can hit good Core Web Vitals on almost any platform with enough discipline. But some stacks make the fast path the default path, which is why we reach for them. On a modern framework like Next.js, a lot of the checklist above is handled for you: automatic image optimization (right format, right size, lazy-loading, and dimensions built in), automatic code-splitting per route, self-hosted and preloaded fonts out of the box, and rendering strategies — static generation, incremental regeneration, and streaming server rendering — that get real HTML to the browser fast instead of making it wait on a giant client bundle. React Server Components go further by shipping less JavaScript to the browser in the first place, which is the cleanest way to fix INP: the fastest script is the one you never send.
I'll be honest, though — a modern framework is not a magic wand. I've audited plenty of slow Next.js sites, because you can absolutely misuse a good tool: dump ten third-party scripts on it, ship megabytes of client components, ignore the image optimizer. The stack removes excuses; it doesn't remove responsibility. If you want the longer argument for why we default to it anyway, I wrote about that in why we build business sites on Next.js.
Frequently asked questions
How much will fixing Core Web Vitals actually increase my sales?
I won't give you a fake number, because it depends entirely on how slow you are now and how much of your traffic is on mobile. What I can tell you honestly: the worse your starting point, the bigger the win. Moving from a "poor" LCP of five-plus seconds into the "good" range is the kind of change that shows up in your conversion rate, not just your reports. If you're already fast, the returns flatten out — going from good to slightly-more-good won't move revenue much. The money is in fixing genuinely slow sites.
Is a high PageSpeed Insights score enough?
No, and this trips people up constantly. That green lab score is a synthetic test on an idealized device. Google judges you on field data from real Chrome users (CrUX), which is almost always harsher. Use the lab score to find and fix problems, but track your Core Web Vitals report in Search Console to know where you truly stand.
What's the single most common problem you find?
Images, without much competition. Enormous, unoptimized image files served at full resolution to phones are the most frequent cause of a bad LCP I see, and images without set dimensions are a top cause of bad CLS. It's also the most satisfying fix, because it's usually the fastest big win on the entire list.
Will good Core Web Vitals get me to the top of Google?
On their own, no. Core Web Vitals are a real but modest ranking factor — a tiebreaker between pages that are already relevant and authoritative. Speed helps you win close races and avoid being outranked by an equally good but faster competitor. Treat it as one important input to SEO, not the whole strategy. The bigger, more reliable payoff is conversion, which improves regardless of where you rank.
How often should I check these metrics?
Check your Search Console Core Web Vitals report monthly as a health check, since the field data is a rolling 28-day window and won't swing overnight. Beyond that, re-measure any time you add a new third-party script, redesign a template, or change your hosting — those are the moments things quietly regress.
The bottom line
Core Web Vitals in 2026 come down to three honest ideas. LCP, INP, and CLS are Google's way of measuring how your site feels to a real person on a real phone. The SEO benefit of fixing them is real but modest — a tiebreaker, not a miracle. And the revenue benefit is the part almost everyone underrates: a faster site converts more of the traffic you already pay for, on every visit, whether or not it ever changes your ranking. If you're buying ads and sending that traffic to a slow page, speed isn't a technical nicety — it's the cheapest growth lever you have.
If you're not sure where your site stands, the fastest way to find out is to measure it. We'll run the numbers for you and tell you the truth about what's costing you money with a free site speed audit — no pitch, just findings. If it turns out the fixes go deeper than a weekend, that's exactly the kind of work our web development team does every day, and you can see typical scope and ranges on our pricing page. Either way, reach out and I'll give you a straight answer.